Understanding Optical Gas Imaging Quantification
Quantitative optical gas imaging offers oil & gas industry operators a tool for improved worker safety, greater environmental stewardship, and more cost-effective operation.
By Craig R O’Neill, FLIR
A relatively young technology, quantitative optical gas imaging (qOGI), is quickly proving itself to be a viable alternative to toxic vapor analyzers and Bacharach Hi Flow® Samplers as a tool for oil and natural gas industry operators to quantify gas leaks. This article describes qOGI, how it works, its applications, and the equipment necessary for its use. The article also details how qOGI compares to alternative leak quantification technologies.
Read the white paper below or download the PDF
WHAT IS QUANTITATIVE OPTICAL GAS IMAGING?
Quantitative optical gas imaging is the ability to utilize optical gas imaging – specifically, cooled hydrocarbon OGI – combined with an algorithmic solution, to quantify gas leaks invisible to the naked eye.
These are leaks you’d normally be able to visualize on your OGI camera. Historically, OGI cameras have been limited to qualitative analysis – indicating that a leak is occurring but giving little indication how much is leaking. Now, though, combining an existing OGI camera with a qOGI solution, you can visualize and quantify such leaks in units of mass and volumetric leak rates, as well as concentration over pathlength (ppm-m).
QOGI VS. ALTERNATIVE TECHNOLOGIES
In terms of capability, neither a toxic vapor analyzer (TVA, commonly referred to as a “sniffer”) nor a Bacharach Hi Flow® Sampler (BHFS) can quantify a variety of gas leaks in mass leak rate and volumetric leak rate, as well as concentration path length. A TVA offers concentration analysis, but no measurement of flow. A BHFS is capable of measuring both flow and concentration.
Both TVA and BHFS devices can return different interpretations of the same leak, depending upon where and when the leak is sampled, as well as how the device is positioned. This shortcoming is a result of these devices’ functionality: they provide a leak snapshot in time, while a qOGI system provides a rolling average leak rate over time.
Additionally, TVA and BHFS devices are limited in their ability to quantify certain gases inspectors may encounter. A qOGI system has the capability to identify and quantify more than 400 chemical compounds. Also, since a qOGI system analyzes information from a recorded OGI camera feed, the user has visual evidence to help confirm the system’s analysis. No other technology offers such surety.
Inspector safety, though, could be qOGI’s greatest advantage. Consider the nature of TVAs and BHFS devices applied to difficult-to-monitor
(DTM) devices -- possible leak sources located at a sufficient distance from the measurer to pose challenges to their quantification.
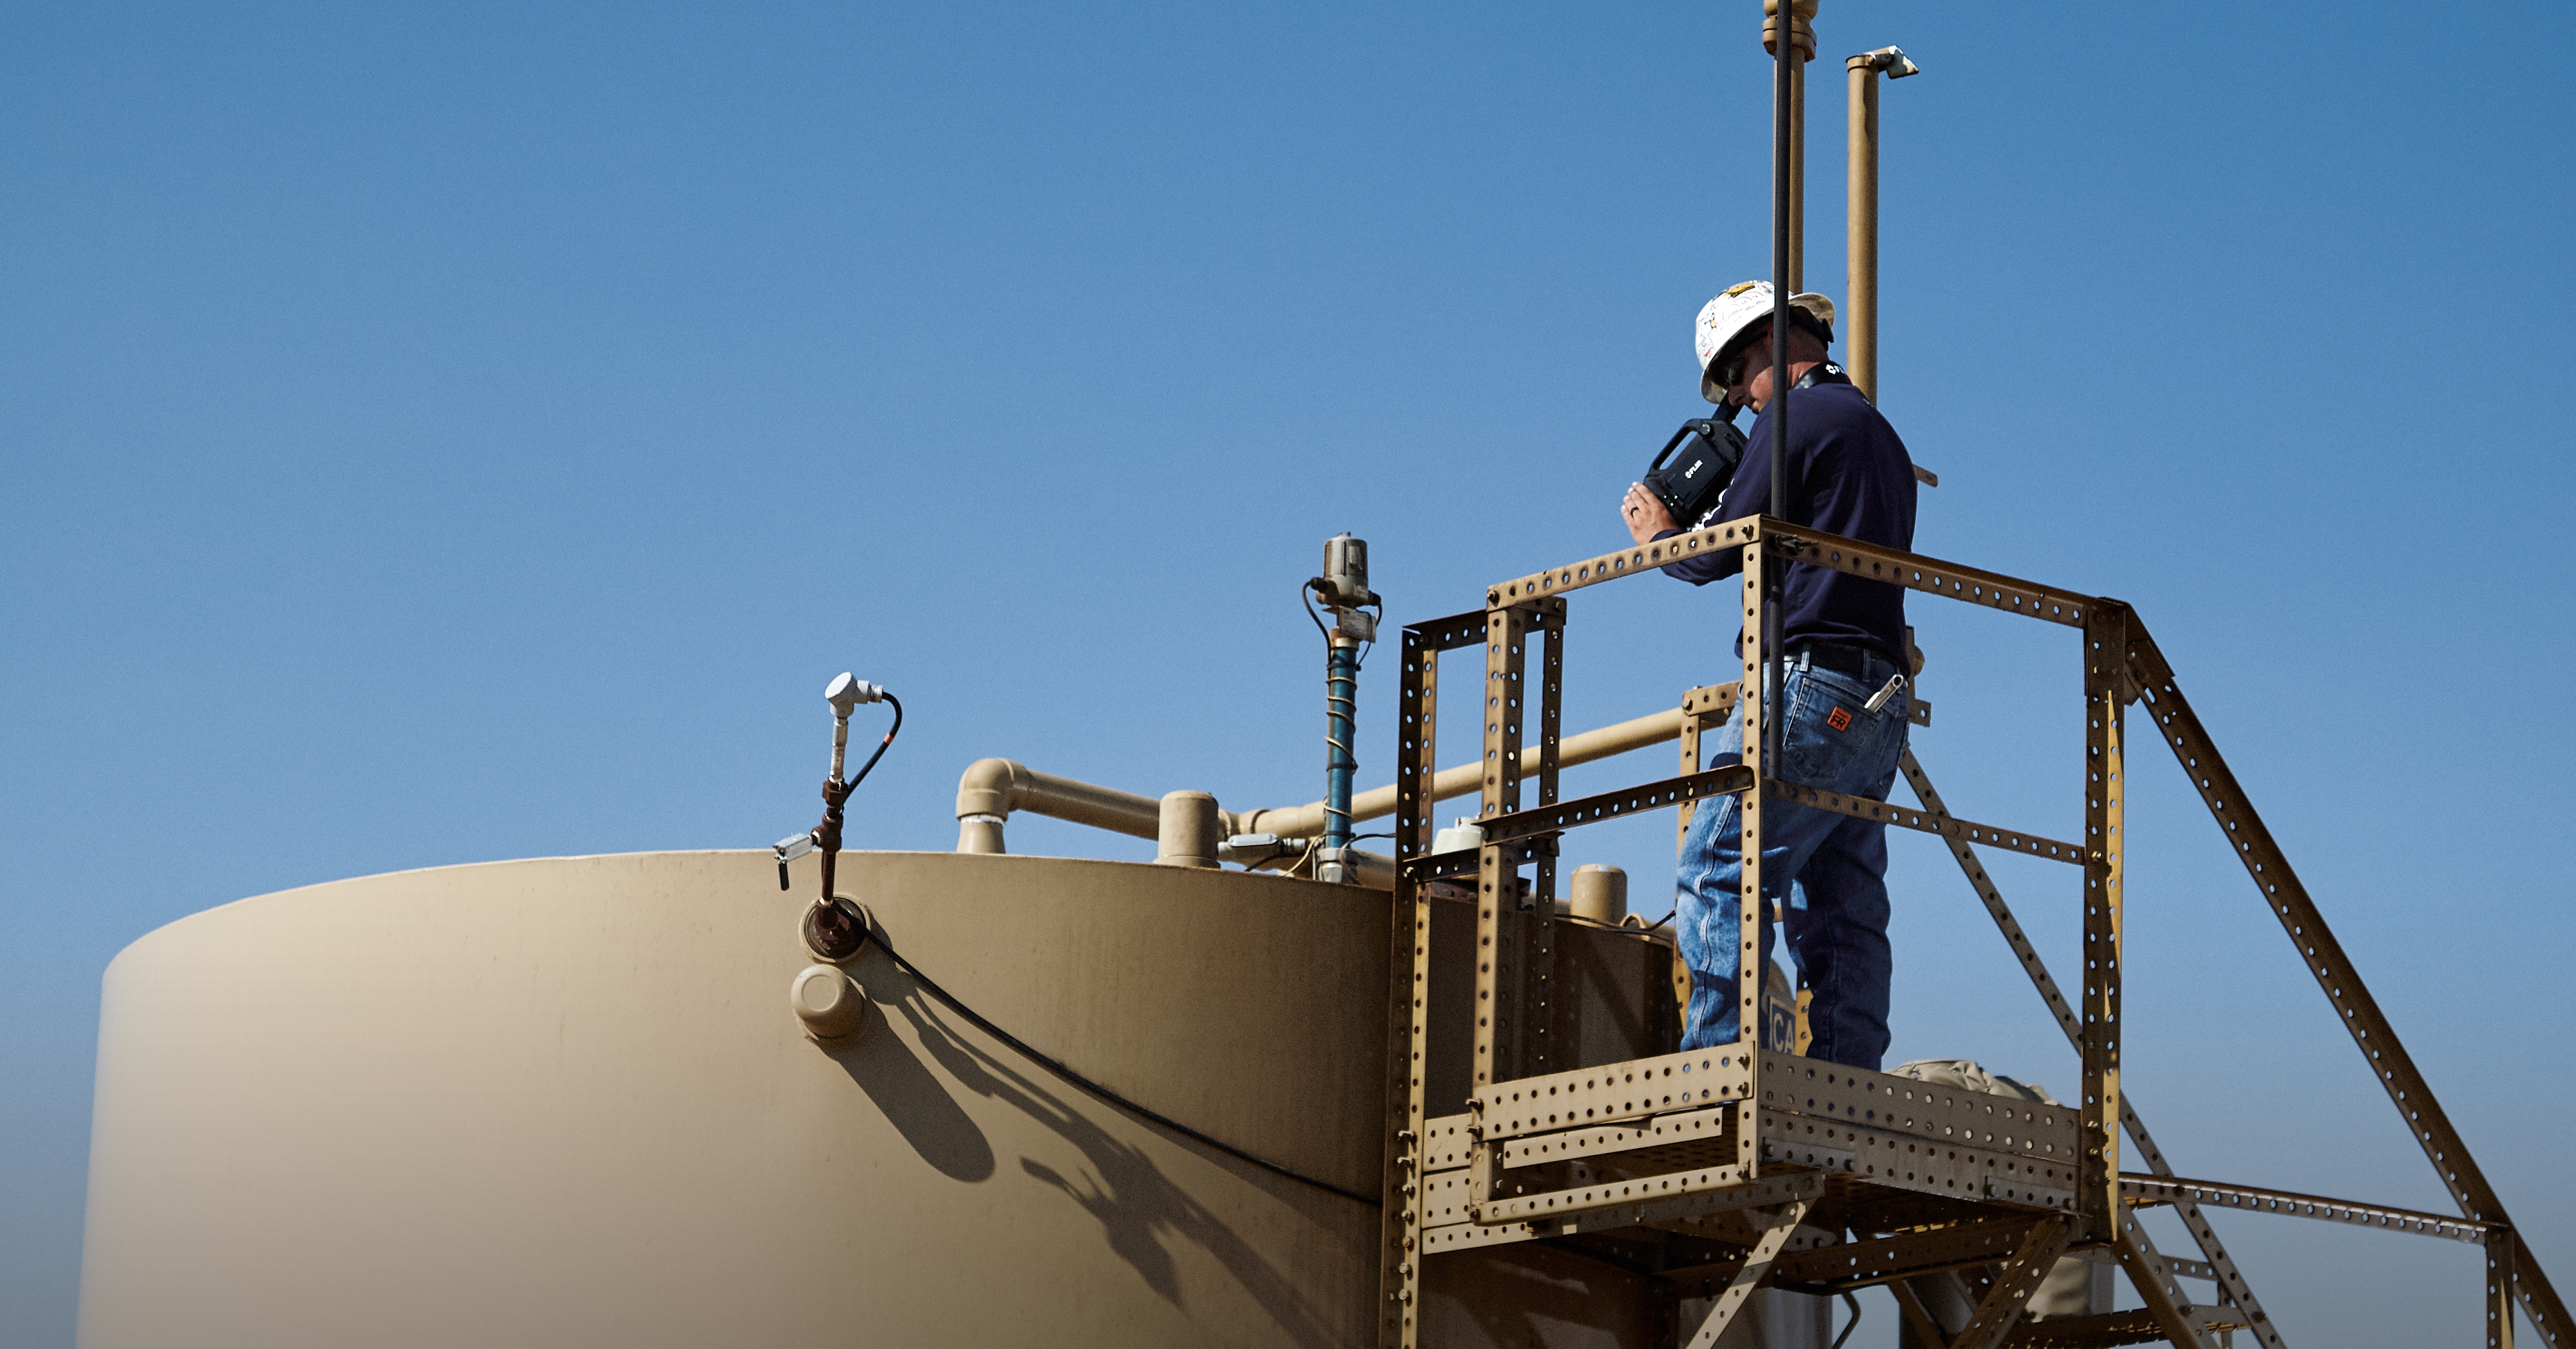
At best, scaffolding can be erected, with the hope that its construction is not too costly or time consuming. Then, an inspector, encumbered by a safety harness and wearing all appropriate personal protective gear, must climb dangerously close to – or, in some cases, within – the plume of escaping gas in an attempt to quantify the leak.
In other cases, the potential leak may be completely inaccessible by an inspector for reasons of safety or a lack of operating space.
Even when a leak is discovered (or suspected) in a more accessible location, a qOGI system provides superior ease of use. A TVA requires frequent calibration using a field calibration kit and works only “in the moment.”
A BHFS, meanwhile, is labor intensive to use and maintain. Its use requires the inspector to seal the leak as best he or she can, using a mishmash of tape and plastic, to allow for the most accurate possible reading. While these devices are capable of high accuracy, they must be calibrated weekly, as well as verified daily.
One also must consider how environmental conditions affect these devices. While a TVA’s reading can be affected by humidity, temperature, and contaminants, wind can have the most dramatic effect, as the technology could potentially miss a leak (Fig. 1); a BHFS’ environmental limitations depend on its particular sensor; a qOGI system’s readings can be affected by temperature (discussed below) and wind speed, which are accounted for in the tablet’s input parameters.
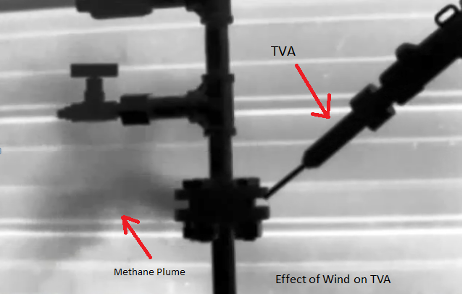
Figure 1 - Wind’s detrimental effect on toxic vapor analyzer (TVA) measurements
HOW DOES QOGI WORK?
The ability to quantify leak size without being near the gas plume is the greatest differentiator between qOGI and competing technologies, as well as qOGI’s greatest advantage. When using OGI cameras at a distance, three factors enable the camera to visualize gas (Fig. 2).
![]()
Figure 2 - Factors affecting gas image in an OGI camera
IR Absorption — α(λ) — First, the gas to be detected must have an IR absorption peak that overlaps with the spectral window of the OGI camera. Response Factors (RFs) have been developed for nearly 400 compounds; these RFs, indicative of the wavelengths at which different gases absorb energy, allow a user to assess whether a chemical compound can be imaged by a specific IR camera. They also can be used to adjust the results from a qOGI method, allowing a single calibration with a single gas to be applied to the measurement of multiple gases.
RF will also specify the sensitivity of a specific compound compared to the reference chemical. For example, the RF for propane is 1. If a RF value for another compound is 0.3, it means the compound has 30 percent of the sensitivity of propane. If a chemical has an RF less than 0.1, it is likely that the chemical will not be visible by OGI cameras under the same conditions as the reference chemical.
Delta Temperature — ΔT — There must exist sufficient temperature differential between the gas plume and the background. A higher ΔT will lead to more visible plume in the OGI camera’s display. For qOGI, a high ΔT means a higher signal-to-noise ratio, which creates better measurement data.
QOGI users will need to view the leak at various angles to ensure the highest ΔT possible. At a minimum, you’re seeking 2°C of difference in temperature between the ambient air near the gas leak and the apparent temperature in the image background. ΔT generally should be considered the most important factor in collecting an accurate reading.
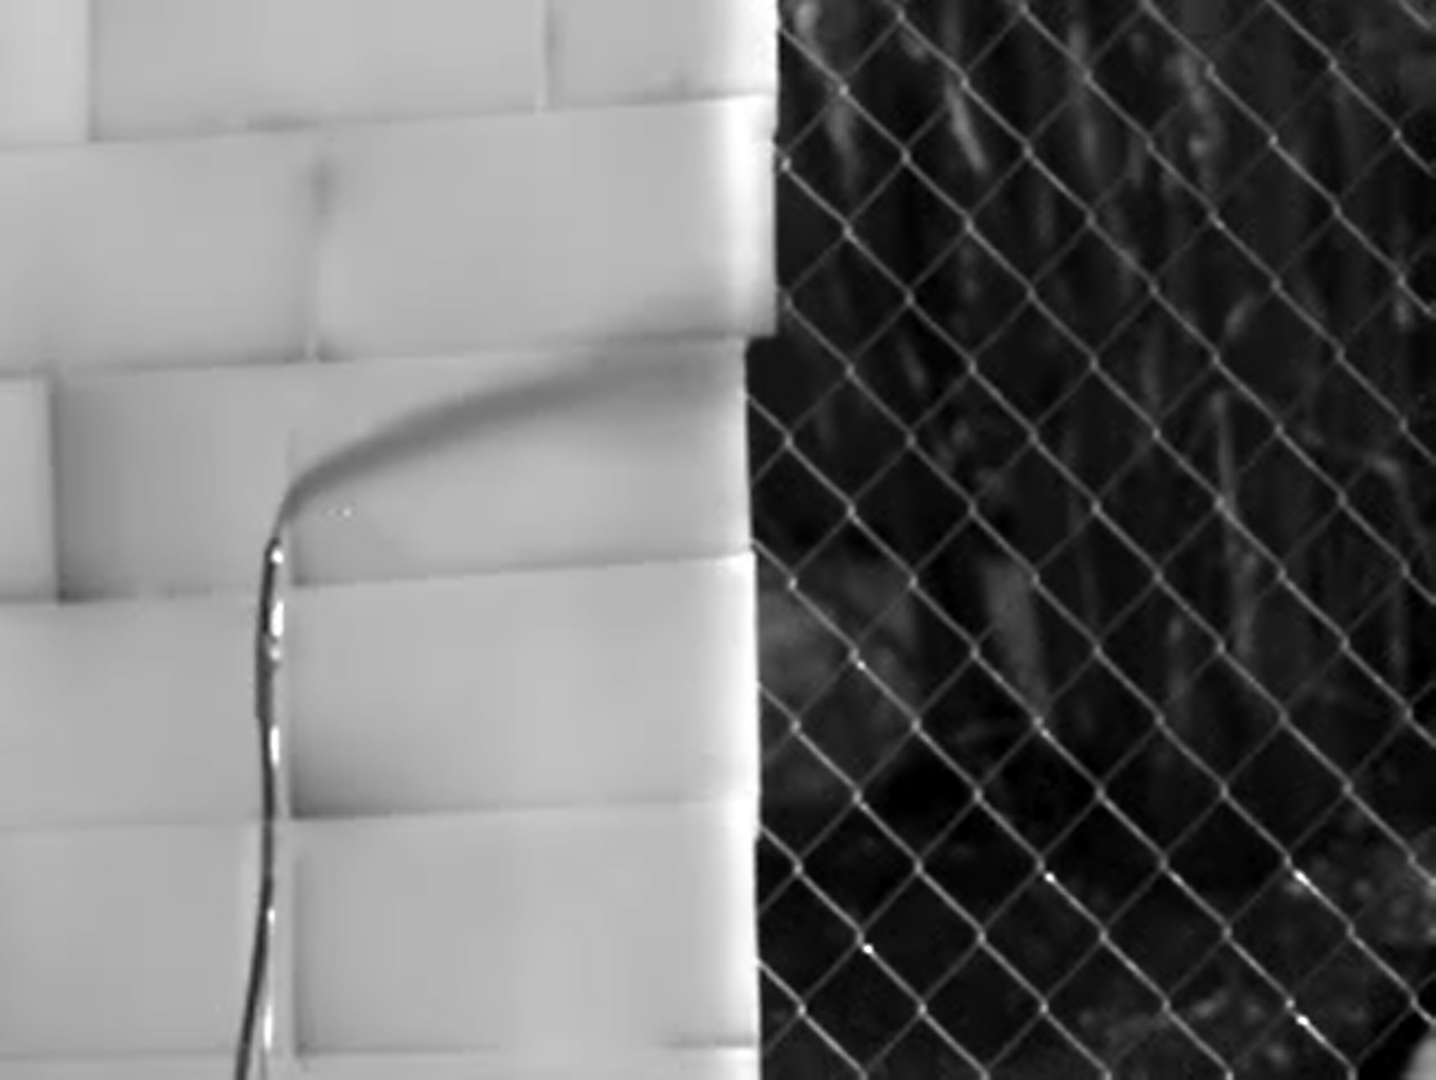 Image of a gas leak showing the effects of Delta T as the gas moves from a hot background (the wall) to a background that is ambient temperature (the fence)
Gas Presence — ɠ — There must be gas present in the image that is greater than the minimum detection limit of the system.
Given that there must be enough gas present in a scene to image, the function of qOGI is to standardize the effect of the other two factors — α(λ) and ΔT — to enable quantification of gas present. This measurement will be consistent under different measurement conditions (e.g., the same reading will yield the same result even when ΔT is different due to different measurement conditions).
QOGI can produce two types of result:
- concentration pathlength, expressed as ppm-m at pixel level, and
- mass or volumetric lead rate (e.g., grams/hr or liters/min).
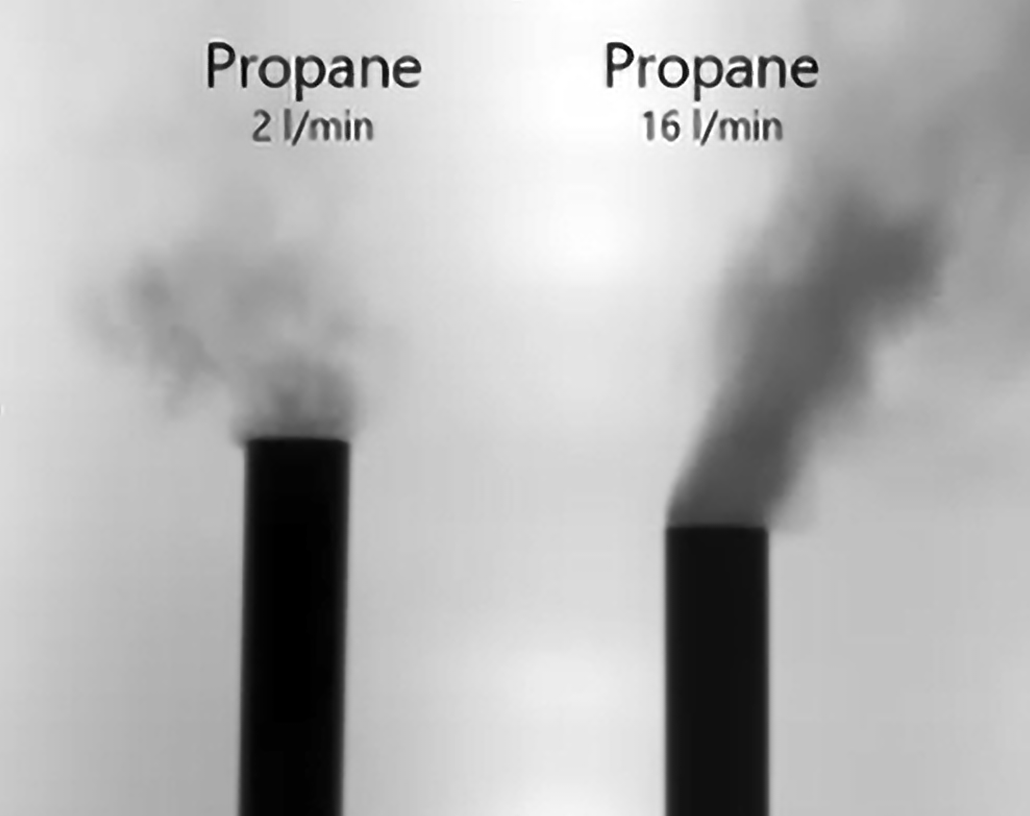
Figure 3 - Examples of propane with varying concentration pathlengths
The mass or volumetric leak rate requires further algorithmic process to aggregate the pixel level measurements into the effect of the leak as a whole. The algorithm also takes into consideration the distance and wind condition that affect the measurement of mass or volumetric leak rate.
A qOGI solution offers two modes of operation: real-time use and Q-Mode operation.
In the field (real-time use), you simply plug a ruggedized tablet computer – containing the software that quantifies the gas being imaged –directly into your FLIR OGI camera (GF320, GFx320, or GF620) and it will immediately begin quantifying the live view of the leak.
FLIR GFx320 Optical Gas Imaging camera
In Q-Mode operation, you’re able to store the video in the camera for later use. You can then download the files to the tablet, allowing you to quantify leaks after the fact.
The tablet itself comprises off-the-shelf technology, designed and manufactured for plug & play use with FLIR OGI cameras (a USB cable connects the devices during field use, and the camera’s SD card can be removed for Q-Mode operation) and does not require regular calibration. Thus, it is seamless to implement qOGI for existing OGI camera users.
Further, the tablet is not subject to the same deterioration of components experienced by TVAs and BHFS systems regularly exposed to toxic gases. While replacement components for TVAs may be readily available, BHFS devices have not been manufactured since 2016.
Finally, note that as qOGI allows users to visualize leaks as part of the quantification process, motion can be detrimental to its performance (as with any camera). Thus, users must stabilize the camera via a tripod.
CONCLUSIONS
Since qOGI is a young technology, no U.S. regulatory driver exists for its usage, but its merits as a tool for internal purposes are clear. Indeed,
a leader in the Oil and Gas industry has field tested2 the technology, exploring its viability for quantifying everything from upstream ICR requests and tank emissions to DTM LDAR components (downstream) and maintenance/reliability monitoring.
In addition to its obvious safety benefits over alternative gas quantification methods, qOGI has been through rigorous third-party testing from CONCAWE3 and proven to be easier, quicker, and more accurate than technologies like a TVA. QOGI is also cost-effective as an add-on to existing OGI cameras and positions oil and gas operators to be at the forward-thinking edge of environmental consciousness in the communities where they operate.
ABOUT THE AUTHOR
Craig R O’Neill has worked for FLIR for over 17 years and been actively involved in the OGI market since the introduction of commercial Optical Gas Imagers in June 2005. Currently, he has global responsibility for the Optical Gas Imaging line of business and the strategy for FLIR’s solutions in the oil and gas industry. In this role, he is the linking piece between customers, industry stakeholders, strategic partners and many vertically integrated aspects of the FLIR Instruments division including sales, marketing, engineering and product management. His goal is to ensure FLIR’s alignment to provide sensing solutions that meet the needs of the oil and gas industry.
ABOUT FLIR SYSTEMS, INC.
Founded in 1978 and headquartered in Wilsonville, Oregon, FLIR Systems is a world-leading maker of sensor systems that enhance perception and heighten awareness, helping to save lives, improve productivity, and protect the environment. Through its nearly 3,500 employees, FLIR’s vision is to be “The World’s Sixth Sense” by leveraging thermal imaging and adjacent technologies to provide innovative, intelligent solutions for security and surveillance, environmental and condition monitoring, outdoor recreation, machine vision, navigation, and advanced threat detection. For more information, please visit www.flir.com and follow @flir.
Resources
1. http://docs.wixstatic.com/ugd/5922b2_fa557e034d654f54865a63902fb93d6e.pdf
2. http://docs.wixstatic.com/ugd/5922b2_0b8501e272274446a9aceda959ff5565.pdf
3. https://www.concawe.eu/wp-content/uploads/2017/01/rpt_17-2.pdf
For more information about optical gas imaging please visit : www.FLIR.com/ogi
Related Articles
-
 Fundamentals
Why Measure Temperature?
Read the Story -
 Recorded Webinar
Thermal Process Monitoring for Thermoforming
Watch now -
 Fundamentals
What do CAT Ratings Mean?
Learn more